Last month, we discussed why understanding your survey respondents really matters. As there is no ‘one size fits all’ approach to survey design, the context of ‘who, what, when, where and why’ is really important to get the insights you need.
With around 70.0% of CoreData general population respondents completing surveys on mobile, the ‘where’ component is becoming more important than ever before.
Using phones for surveys presents new challenges
The fact the world is now smart phone-obsessed matters because your phone is not your desktop. While you’re answering the same questions, the presentation will shift to fit the form factor and your phone has a range of distractions that your PC doesn’t.
Those distractions can make a difference. Even after accounting for question and respondent characteristics, one study found item response times for phone users were 17.0% higher on average than for desktop users. By eliminating screen size and technological difficulties as factors, the authors concluded this difference was mainly due to the devices and survey-taking environment having more distractions (note 1).

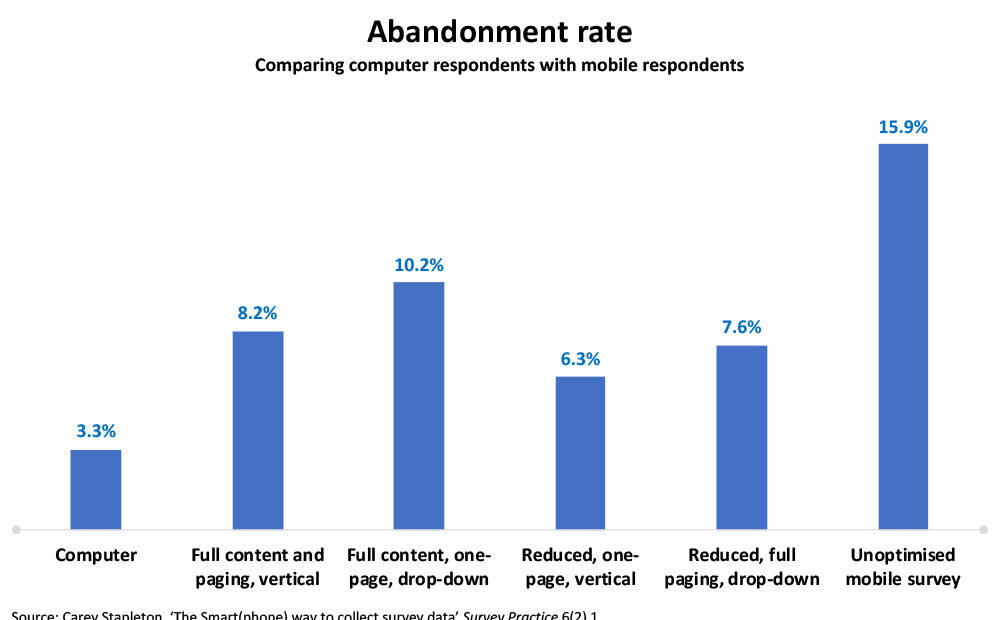
The full drop-out rates for these conditions are displayed in the accompanying chart.
Similarly, surveys completed on mobiles are more likely to be abandoned and have greater vulnerability to ordinal bias than those on a desktop. In a consumer study with more than 2,000 respondents, only 3.3% of desktop users abandoned the survey but a whopping 15.9% of mobile users did when the survey was unoptimised for these devices. Furthermore, mobile users were more likely to say they were ‘highly satisfied’ with the brand than desktop users. This difference was statistically significant, even when controlling for mobile and desktop user demographics (2).
The underlying question is how to address the problem of the ‘unintended mobile respondent’ – that is, people who use phones to answer surveys that were designed with desktops in mind (3). In fact, despite the large number of survey responses coming from phones, only 2.0% of surveys are actually optimised for these devices (4).
There are steps you can take
Thankfully, there are ways of mitigating many of these problems. Returning to the consumer study above, the authors were able to lower drop-outs by reducing the number of questions, placing all of them on a single page and using vertical scrolling instead of a paging system.
Similarly, a meta-analysis on mobile user dropout rates concludes the following survey design factors can help:
- Decreasing the length of your survey
- Reducing your survey’s design complexity by removing items like grids, sliders, drop-downs and progress indicators
- Using email invitations instead of SMS notifications
- Using a large number of survey reminders (5)
Getting your design right
Of course, just because solutions exist doesn’t mean you should blindly implement all of them. For instance, while reducing your survey length might discourage mobile users from dropping out, it could also remove the depth of insight you require. With that in mind, here are three questions to ask yourself when designing your survey:
- Who is my audience? As we covered previously, different cohorts tend to answer surveys in different ways and this is also true for the platforms people use. As one consulting firm found, depending on the survey and audience, the proportion responding from mobiles may be as low as 3% and as high as 57% (6). There’s no point stripping back a survey for mobile if the bulk of your audience are likely to be using PCs.
- How much complexity do I need? Complex question types such as grids and drop-down boxes tend to slow down mobile respondents, but they may also provide a layer of granularity that your project needs. Understand the trade-offs so you can make an informed decision.
- What accommodations are already built into my platform? Some survey platforms can accommodate for different devices as part of the software. For example, CoreData’s proprietary platform can dynamically alter questions depending on whether a respondent is on mobile or desktop.
While there’s no way to know for sure how many people will do your online survey on a desktop versus mobile, with nine in 10 Australians owning a smartphone, (7) and many people doing surveys in their ‘dead’ time – like catching public transport or over their lunch break – it’s safe to assume that mobile usage will be high. Knowing the pitfalls of failing to optimise for mobile could be the difference between hitting the minimum sample you need for your study and falling short.
[1] Ioannis Andreadis, ‘Chapter 5: Comparison of Response Times Between Desktop and Smartphone Users’ from Mobile Research Methods: Opportunities and Challenges of Mobile Research Methodologies (Ubiquity Press, London).
[2] Carey Stapleton, ‘The Smart(phone) way to collect survey data’ Survey Practice 6(2) 1.
[3] For further discussion see Robert Pinter, Daniele Toninelli and Pablo de Pedraza, ‘Chapter 1: Mobile Research Methods: Possibilities and Issues of a New Promising Way of Conducting Research’ from Mobile Research Methods: Opportunities and Challenges of Mobile Research Methodologies(Ubiquity Press, London).
[4] Ibid.
[5] Aigul Mavletova and Mick P Couper ‘Chapter 6: A Meta-Analysis of Breakoff Rates in Mobile Web Surveys’ from Mobile Research Methods: Opportunities and Challenges of Mobile Research Methodologies (Ubiquity Press, London).
[6] B2B International, What proportion of online surveys are conducted using a smartphone?, https://www.b2binternational.com/research/methods/faq/mobile-surveys/
[7] Consultancy.com.au, 9 out of 10 Australians now own a Smartphone, https://www.consultancy.com.au/news/616/9-out-of-10-australian-citizens-now-own-a-smartphone