
CoreData research has shown that only around one-third of financial advice firms conduct formal and regular surveys to keep in touch with clients and what they’re thinking.
In other words, two-thirds of advice firms are relying on gut-feel and guesswork when it comes to understanding what aspects of their services clients are satisfied with, and what aspects may need attention.
Financial advisers who do regular client satisfaction surveys report using the results to improve client communications, and to fine-tune existing services. But it’s worth remembering that the value of a survey’s results depends on the quality of the survey itself. Best practice is a well sought-after but often contested goal in survey design. How many questions should I ask? How should I ask them? What combination of buttons, sliders and images will give me the answers I’m after? How can I reduce survey fatigue and drop out?
If you have a look around, there’s no shortage of solutions. On one hand, you have metrics like Net Promoter Score (NPS) claiming to be “the only metric you need to grow” and on the other, academic journals have been showcasing articles for decades on topics like how many anchors a scale should have.
With free survey tools allowing anyone to become a researcher it’s easy to forget why good design matters.
Good survey design can ensure you are capturing accurate data about what your customers want, and why they want it. According to a white paper The ROI of Data Quality by American tech company Pitney-Bowes, four in five companies have difficulty generating meaningful business intelligence[1], so this is a useful skill for any company to have.
We want our surveys to paint real pictures, and we facilitate this by designing them in ways that reduce bias. We can manage this to an extent during the data cleaning phase by excluding people who complete the survey too quickly or those who ‘straight line’, where respondents choose the same response every time.
The problem of course, is that no set of standards will be equally effective at reducing bias for every person. In fact, existing literature has highlighted many things that can influence bias including age, education, culture, relationship to the subject matter and motivation to complete the survey.
Striving for best practice clearly requires careful consideration of both your audience and the research context.
Best practice in the financial services sector
As is common for psychology and psychometrics as a whole, most survey design experiments that have been carried out have used either undergraduate students or a general population sample.
These audiences are less relevant for financial services organisations, who are often researching the views of professionals such as financial planners, mortgage brokers and savvy investors.
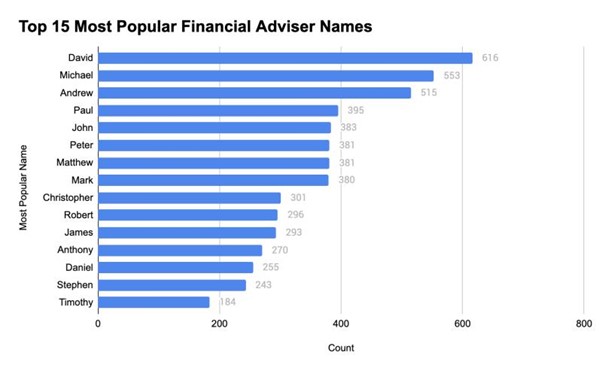
For example, we know the financial planning sector is male dominated. In fact, the most common name among planners is David.
On the issue of gender, one study found that men dropped out of their survey faster than women, but that this difference was mediated when a forced response option was added. [2] Similarly, age can also play a key role in order effects and other cognitive biases.
We also know that due to the accreditation requirements to practice as a financial planner, advisers are more likely to be educated – and education can have a significant impact on the way people respond.
In a general population study of more than 700 people, it was found that people with lower levels of education were more likely to drop out of the survey when sliders were used instead of straightforward radio buttons.[3]
In another study of more than 1,000 undergraduate students, the researchers recommended seven scale points should be used for groups with high verbal and cognitive skills (like university students), but five for a general population.[4]
Using the same reasoning, we can draw similar hypotheses about other aspects of survey design. For example, we know that forced choice questions require much deeper processing than looser formats like ‘check all that apply’.
More research is needed to inform survey design in the sector
At CoreData, we’re investing time and resources in investigating the optimal survey design and question scales for professional financial services audiences.
There is no ‘one size fits all’ approach to survey design and most things a researcher needs to consider represent a trade-off between competing needs for detail and accuracy.
While the literature suggests financial services professionals may be able to provide greater detail when answering a survey than a general population sample, more work is required to build an accurate picture of best practice.
Watch this space.
[1] Nancy Couture, How to integrate business data with business, IT partnerships, CIO Australia, <https://www.cio.com/article/3060839/how-to-intigrate-business-data-with-business-it-partnerships.html>.
[2] Stefan Stieger, Ulf-Dietrich Reips and Martin Voracek, ‘Forced-Response in Online Surveys: Bias from Reactance and an Increase in Sex-Specific Dropout’ (2017) Journal of the American Society for Information Science and Technology 58(11) 1653.
[3] Frederik Funke, Ulf-Dietrich Reips and Randall K Thomas, ‘Sliders for the Smart: Type of Rating Scale on the Web Interacts with Education Level’ (2011) Social Science Computer Review 29(2) 221.
[4] Bert Weijters, Elke Cabooter and Niels Schillewaert, ‘The effect of rating scale format on response styles: The number of response categories and response category labels’ (2010) International Journal of Research in Marketing 27 236.